


Written by Gerard Castro, Tyler Anderson & Yazmina Zurita, part from Nebbo technical team.
This blog post is a continuation of our series, so far composed by the March, April and May outlooks. Here, we will look at the expected wind forecast for the month of June, as well as the “observations” (ERA5 reanalysis) for the past May.
Disclaimer: The rationale behind these outlooks is to present the capabilities and limitations of the most well-known seasonal models. These are obtained from C3S and bundled in a multi-model fashion, without any other complex postprocessing. In particular, a more indepth analysis would require features as those present in our site forecast product:
- Model downscaling to remove bias & variance issues, as well as reliability problems, by increasing the resolution
- If no finer observational reference is used (no downscaling), the models’ resolution is 1º.
- Full probabilistic overview
- Re-forecast skill analysis & accounting for the forecast error
With that in mind, both the May ERA5 map as well as the India forecasts initialized this June 2025 are presented below. The latter forecasts correspond to our multi model aggregation and lead month 1: i.e. valid for the end of this June.
For more information on the process followed in order to generate (& interpret) all the visualizations, one can refer to the corresponding section in our previous posts.
Observations for May 2025: ERA5 reanalysis
We now compare the forecasts for May 2025 issued in March (lead month 3), April (lead month 2), and May (lead month 1) against ERA5 reanalysis data (Figure 1).
As a reminder, observational data comes from ERA5 at 100 m height and 0.25° spatial resolution, whereas model forecasts are at 10 m and 1° resolution. Anomalies help reduce systematic differences between levels and resolution, improving comparability. However, some mismatch between both quantities is expected, which underscores the need for proper downscaling.
We retain the same regional definitions used in earlier analyses:
- Region 1: North Karnataka, southeast Maharashtra, and west Telangana.
- Region 2: North Gujarat.
- Region 3: East Kerala and West Tamil Nadu.
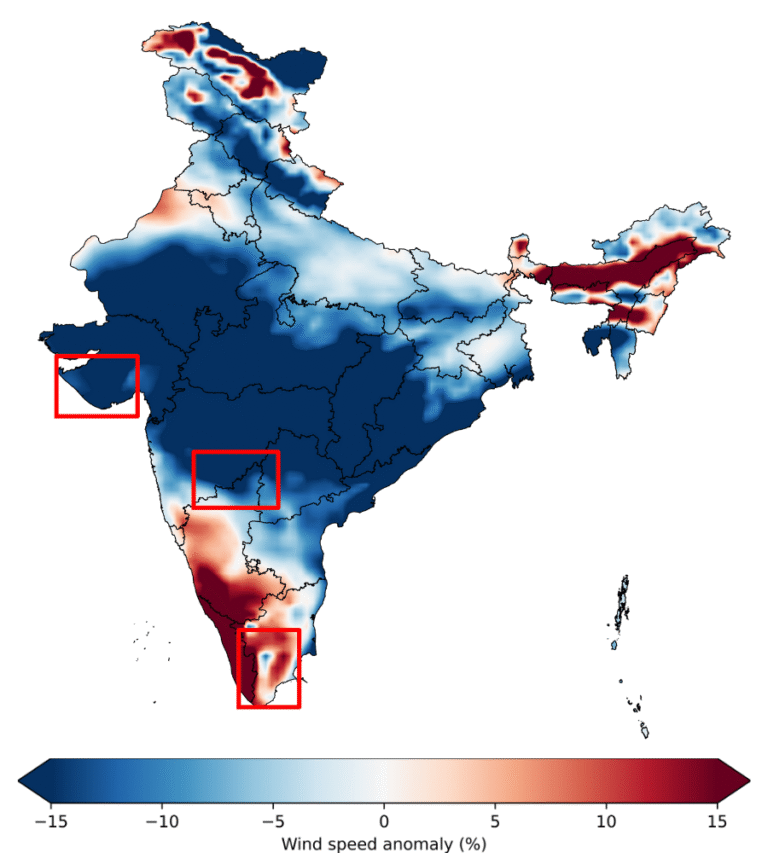
Fig 1. ERA5 100m wind speed anomaly map for India. In red, the regions to focus on. Baseline period: 1993-2016.
Let us perform an analysis on how Figure 1 compares to our previous forecasts segmenting it by region:
-
- Region 1:
- In May 2025, Region 1 exhibited strong negative wind anomalies, particularly pronounced in the northern part of the region.
- The May forecast (lead 1) leaned toward normal wind conditions across the area, assigning limited probability to below-normal wind speeds but excluding the likelihood of significantly windier conditions.
- The April forecast (lead 2) showed a slight preference for normal or stronger-than-usual winds, assigning low probability to lower wind activity.
- The March forecast (lead 3) projected a clear signal toward above-normal wind speeds, while almost fully discounting the possibility of reduced wind speeds.
- In summary, the forecasts increasingly reflected the actual outcome as the target date approached. The March forecast diverged most from the observed outcome, while April and May predictions better captured the absence of windier conditions but assigned low probability to the low-wind scenario that eventually occurred—indicating that the event was unexpected.
- Region 2:
- May 2025 reanalysis indicated consistently low wind speed anomalies across Region 2, with minimal spatial variation.
- The May forecast (lead 1) displayed a modest signal favoring higher wind speeds, particularly in the western section, but maintained balanced probabilities elsewhere, indicating uncertainty.
- The April forecast (lead 2) lacked a dominant signal, showing nearly equal chances for all three terciles—lower, normal, and higher wind speeds—offering limited predictive value.
- The March forecast (lead 3) suggested a clear bias toward windier conditions, although it did not entirely rule out normal or calmer outcomes.
- In conclusion, none of the forecasts strongly anticipated the widespread and consistent drop in wind speeds. The March outlook was least aligned with observations, while April and May did not assign meaningful probability to any event—particularly the unusually calm conditions that emerged—suggesting that all events were almost equally likely.
- Region 3:
- Region 3 in May 2025 saw widespread above-normal wind anomalies, except for a central zone with reduced wind velocities.
- The May forecast (lead 1) pointed toward normal wind conditions, with low probability assigned to increased or decreased wind activity.
- The April forecast (lead 2) hinted at a moderate signal toward normal and higher wind speeds, though without strong confidence.
- The March forecast (lead 3) presented a strong signal favoring windier-than-normal conditions and largely ruled out below-average wind scenarios.
- Overall, the March forecast offered the best alignment with observed conditions, capturing the general tendency for enhanced wind activity. In contrast, the April and May forecasts were less consistent with the observed anomalies, placing lower probabilities on the stronger wind signals that ultimately occurred.
- Region 1:
Summary
In short, the analysis of May 2025 wind speed anomalies across the three regions reveals a range of forecast behaviors. While some large-scale tendencies were captured—particularly in Region 3 by the March forecast—low wind speed events in Regions 1 and 2 were generally considered unlikely and received low probabilities. As the target date approached, forecasts became more focused, though they still often spread probability across multiple outcomes, limiting confidence in any single scenario.
These results emphasize the value of improving spatial and vertical resolution in forecasting systems. Advanced downscaling techniques, such as those employed by Nebbo in its asset-level forecasts, can refine the distribution of probabilities—helping forecasts more consistently assign higher likelihoods to outcomes that actually occur. By better resolving local wind patterns, these methods reduce uncertainty and enhance the actionable confidence of seasonal forecasts, supporting more decisive planning in weather-sensitive operations.
Forecast for June 2025: lead month 1
To clearly communicate the upcoming wind forecast for India by the end of June, we start by looking at the ensemble mean anomaly map in Figure 2. This map shows areas with higher wind speeds in red and lower wind speeds in blue.
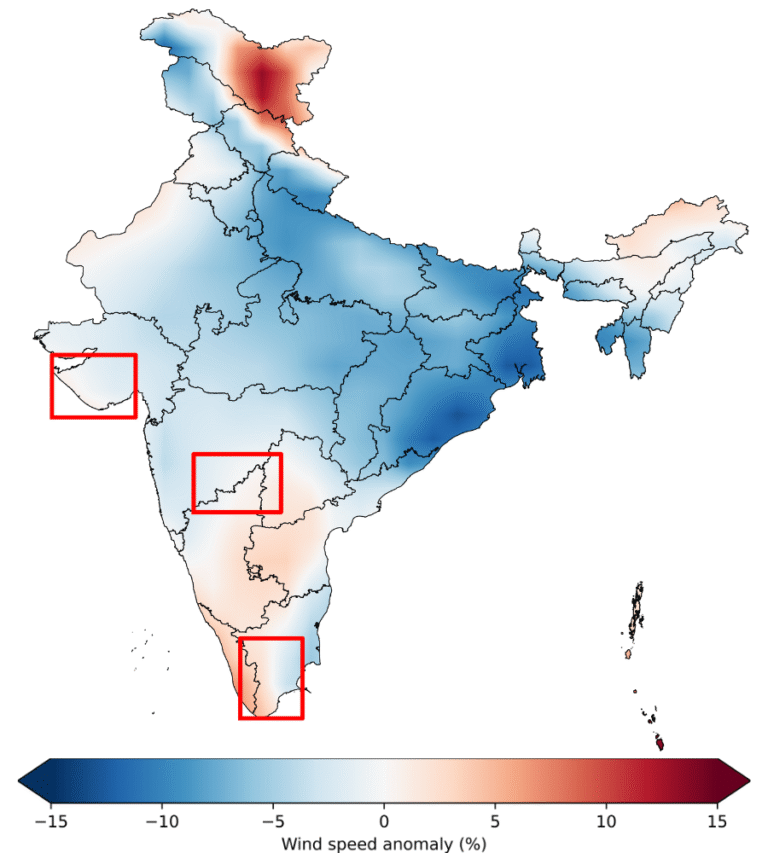
Fig 2. Multi-model wind speed anomaly (ensmean). In red, the regions to focus on. Baseline period: 1993-2016.
Although it highlights expected changes in wind speed across India, it doesn’t indicate how likely these changes are. For that, we turn to Figure 3, which breaks down the probability of experiencing less windy, normal, or windier conditions.
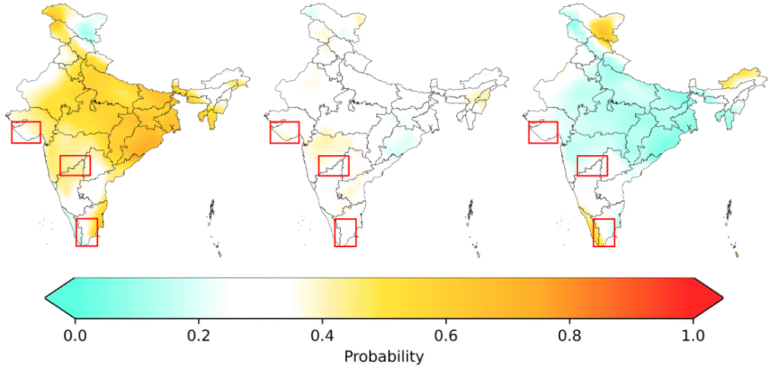
Fig 3. Multi-model probability. From left to right: low, normal & high wind probabilities. Baseline period: 1993-2016.
Now, let us focus on the three regions. Apart from a specific analysis, in the following section the forecasts initialized in June are compared with those initialized in May and initialized in April.
- Region 1
- The forecast indicates a fairly robust signal for low wind conditions in the north-west part of the region, with windier-than-normal scenarios being largely dismissed across this part of the region. The rest of the region shows a faint signal for low wind conditions.
- Comparing this with previous predictions (lead months 3 and 2), there has been a gradual shift towards low wind conditions in the north-west part of the region. Lead month 3 showed almost no signal for this region in any direction, but at lead month 2, we saw a somewhat significant signal indicating low wind conditions in the north-west part of the region. This signal has increased even more in lead month 1.
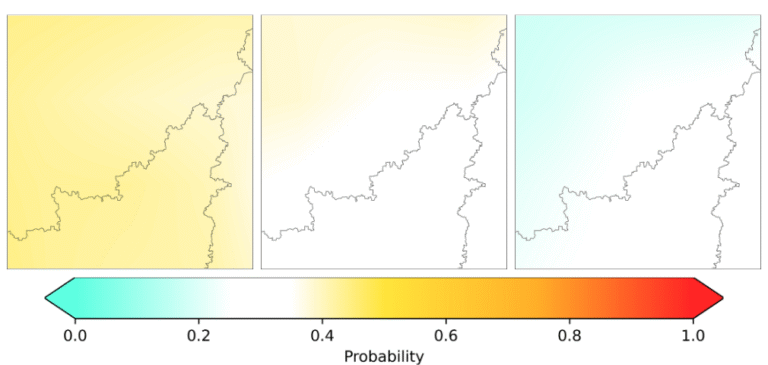
Fig 4. Multi-model probabilities for region 1 (from left to right: probability of having less, average & more wind).
- Region 2
- The current forecast suggests a stronger likelihood of low wind speed conditions in the eastern part of this region, though the rest of the area remains uncertain, with probabilities fairly evenly distributed across different outcomes.
- In lead month 3, the forecast was mostly evenly distributed across the entire region with a very faint signal in the east of the region indicating low wind speeds. In contrast, lead month 2 showed strong indications that there would be low wind speed conditions throughout the entire region. Comparing these to lead month 1, there seems to be a return to the forecast preferring a less windy month in the eastern part of the region.
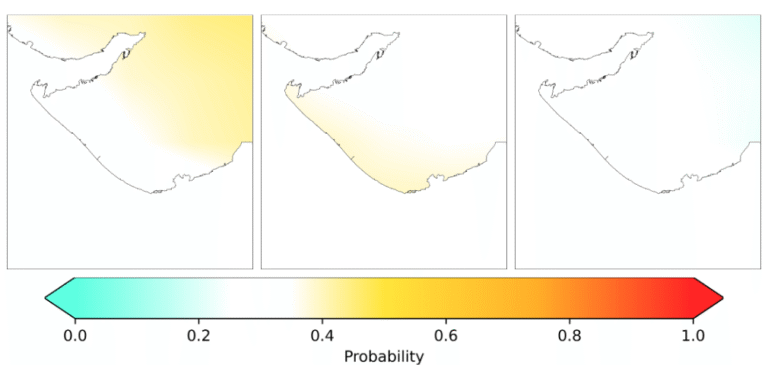
Fig 5. Multi-model probabilities for region 2 (from left to right: probability of having less, average & more wind).
- Region 3
- In this region, low wind conditions in the east and high wind conditions in the west are highly likely, with the central part of the region being uncertain since the ensemble members are evenly distributed in that region.
- In lead month 3, there was a signal indicating high wind speeds in the west of the region, but the rest of the region being fairly uncertain. Then, in lead month 2, we saw a loss in most of the signal for the region. Compared to lead month 1, we can see that the signal has returned to a stronger version of the signal that was present in lead month 3.
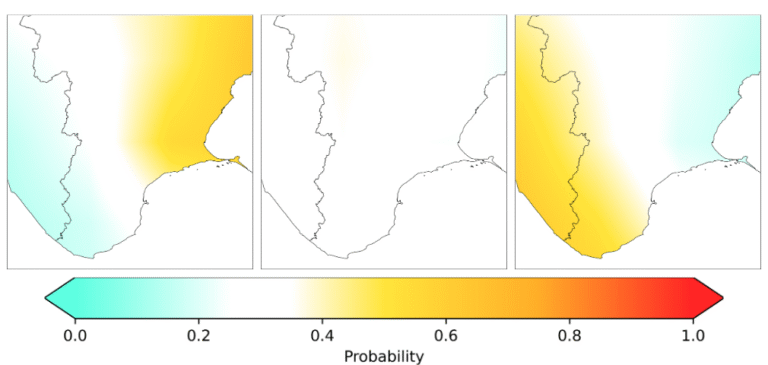
Fig 6. Multi-model probabilities for region 3 (from left to right: probability of having less, average & more wind).
Summary
In this blog post, we analyzed multi-model wind forecasts for June 2025 across three regions in India, as well as past May observations according to ERA5 reanalysis data. The analysis of May 2025 wind speed anomalies revealed a range of forecast behaviors, highlighting the value of improving spatial and vertical resolution in forecasting systems for better precision.
For June, Region 1 is expected to see robust low wind conditions in the north-west, with a faint signal for low wind elsewhere. Region 2 suggests a stronger likelihood of low wind speed conditions in the eastern part, with uncertainty in the rest of the area. Region 3 shows high likelihood of low wind conditions in the east and high wind conditions in the west, with the central part being uncertain.
These insights aim to better prepare for the changing wind dynamics as the Monsoon progresses, emphasizing the importance of refined modeling techniques.
