

El Niño 2026’s impact in wind: what 55 years of ERA5 data show
Written by Gerard Castro, Head of Technology at Nebbo.
In a recent post, we examined the El Niño 2026 forecast — the growing signal, the spring predictability barrier, and the case for acting early. That post focused on whether El Niño is coming and how strong it might be.This one addresses what comes next. If El Niño develops as expected, it will peak this winter — as ENSO events typically do between November and January. What does that mean for wind resource?
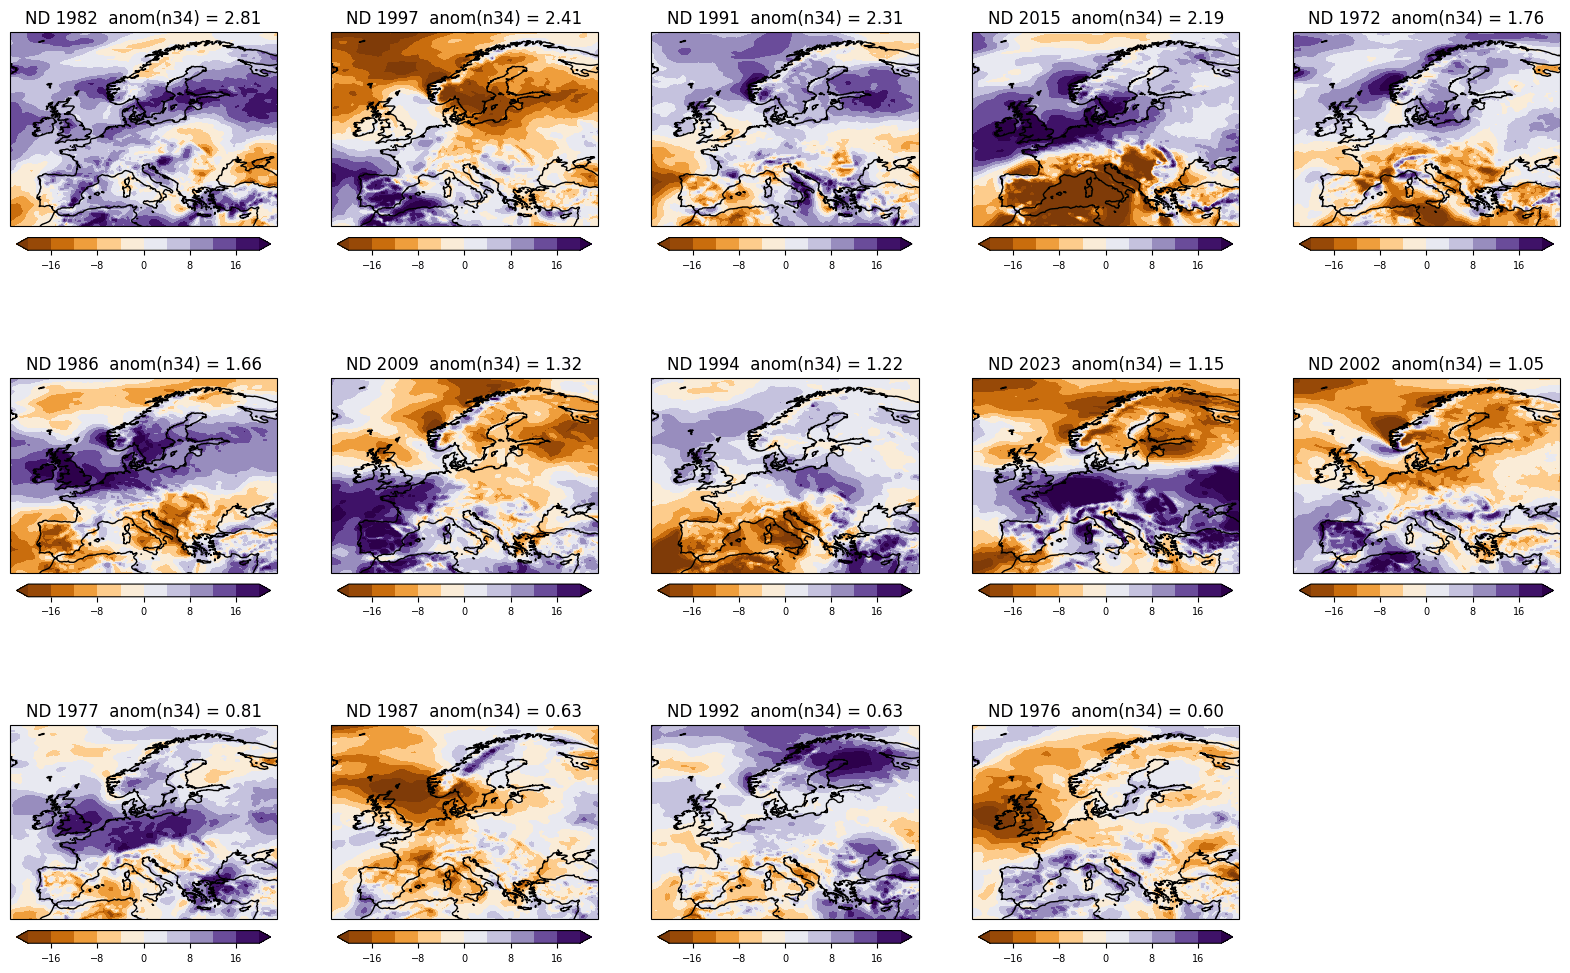
The short answer: El Niño shifts the probability distribution of wind outcomes across large parts of the world. In Europe, the signal shows up most clearly in the first half of winter. It is most relevant for operators exposed to Northwest European and offshore North Sea markets. However, it is not a guarantee of any particular outcome. The spread across historical El Niño winters is wide, and that spread is the most important thing to understand.
This post draws on a new analysis published by ECMWF’s C3S, authored by Christopher Goddard [1], who builds ERA5-based composites spanning 55 years to characterise ENSO’s global and European impacts.
El Niño’s reach: from Tropical Pacific to European pressure maps
What ERA5 shows: the two halves of an European El Niño winter
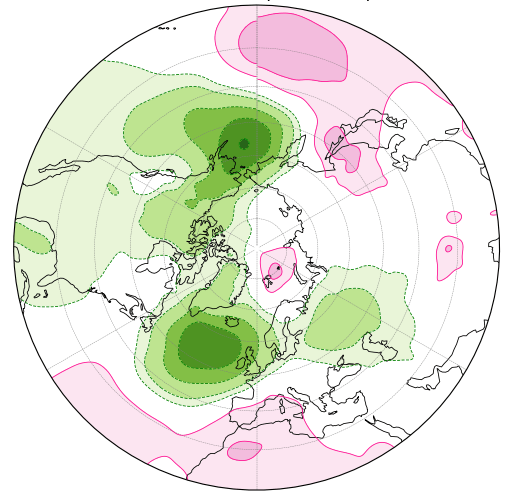
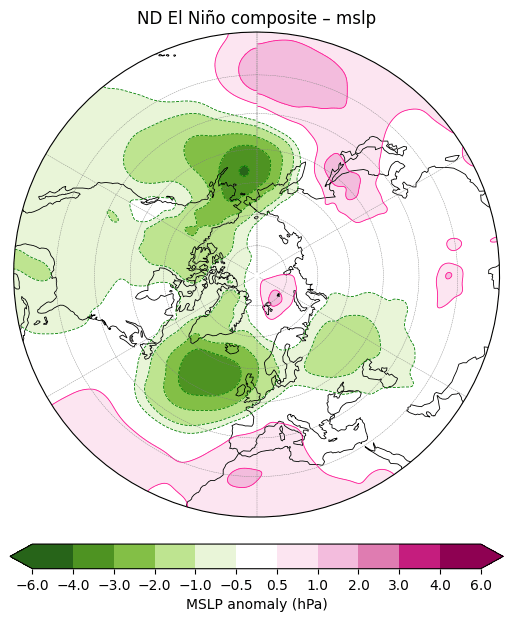
- November–December: El Niño composites show a strong negative MSLP anomaly over the North Atlantic. Positive anomalies appear to the south and east. This pattern is associated with enhanced westerlies over Northwest Europe — a wind-favourable signal for UK, Irish Sea, and North Sea markets. Moreover, the composite response is fairly coherent across historical El Niño events in this sub-period.
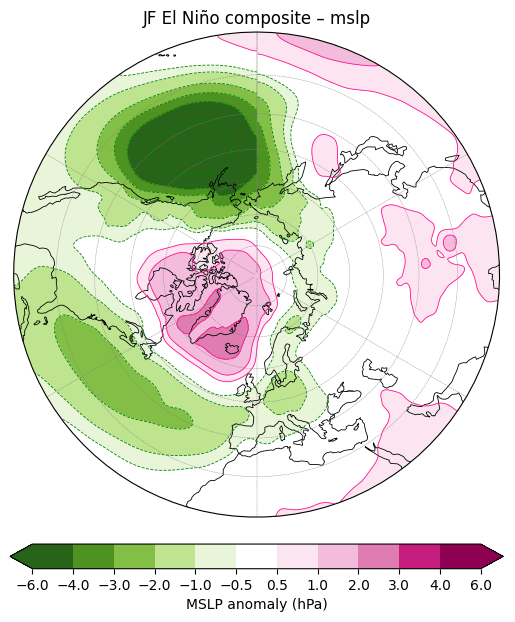
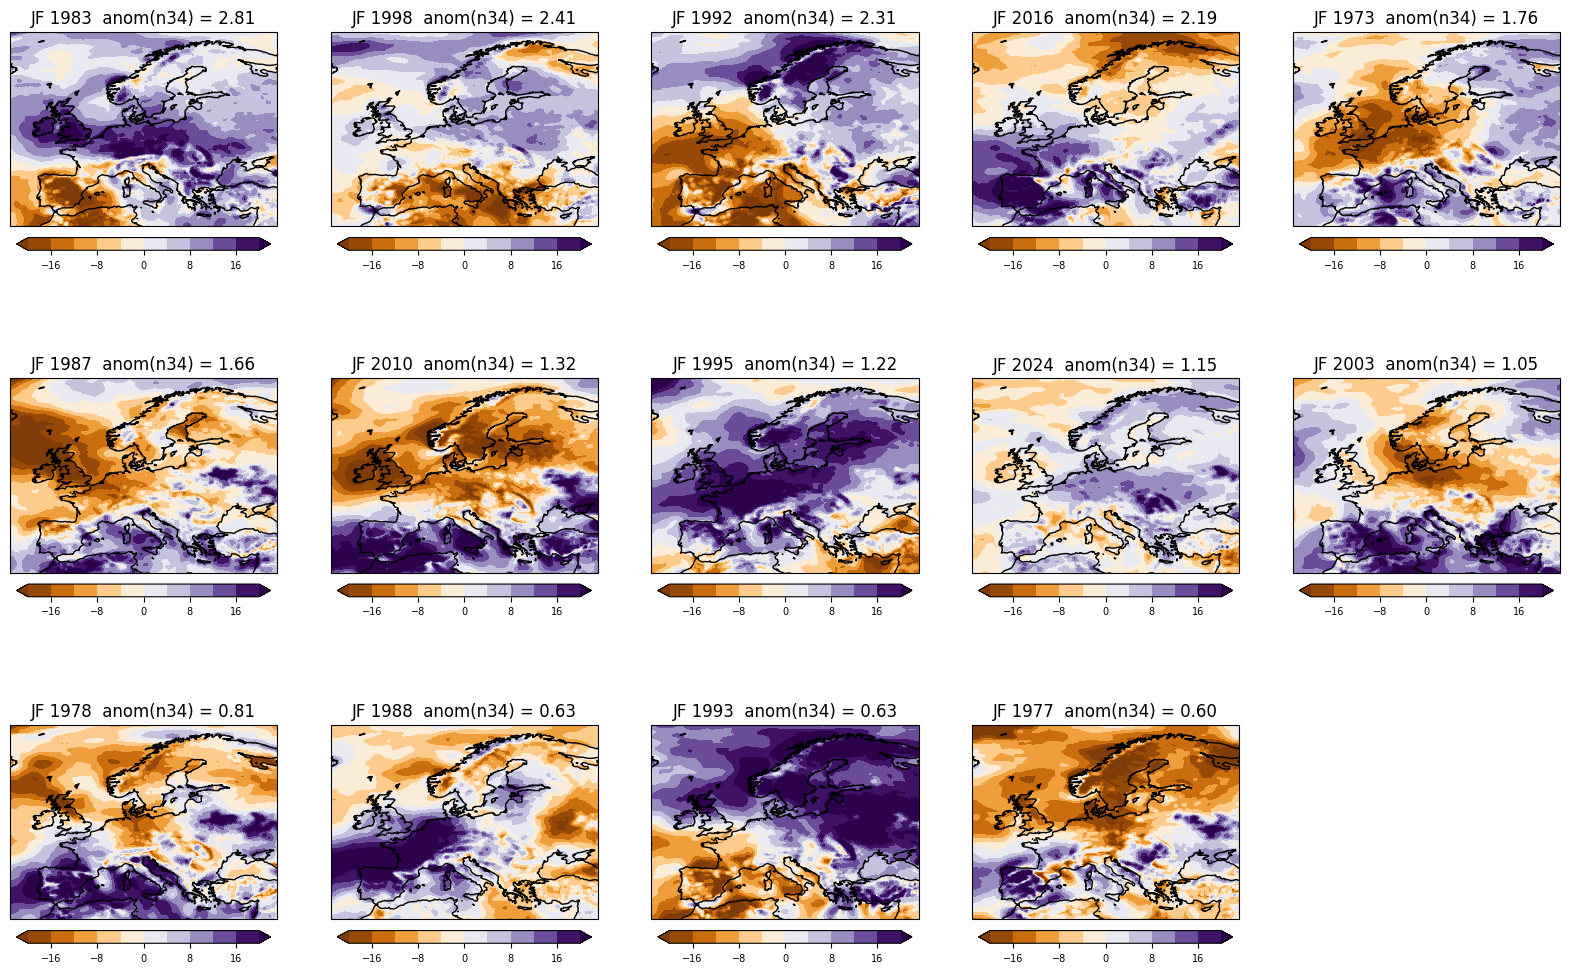
- January–February: the pattern evolves. The atmospheric response becomes structurally different from early winter, and the signal weakens. Molteni and Brookshaw (2023) [2] find the same early-to-late winter transition in ECMWF and C3S seasonal systems. They note that the two sub-periods require distinct treatment. Consequently, planning for the full November–February period as a uniform block will obscure the real structure of the risk.
The diversity problem
The global picture
What this means for wind operators and asset managers
- P50 assumptions can drift during ENSO years: a strong El Niño shifts the distribution of November–December wind outcomes across Northwest European markets. Capacity factor projections built on climatological means will miss this.
- The two halves of winter are not the same: the early-winter signal (Nov–Dec) is more coherent and actionable; in contrast, the late-winter signal (Jan–Feb) is weaker and more uncertain. Month-by-month scenario planning is therefore more robust than a single seasonal average.
- North Sea and UK offshore wind are particularly sensitive to NAO-like pressure patterns, which El Niño tends to favour in early winter. Assets in these markets carry the most direct exposure.
- Correlated portfolio exposure: an ENSO-conditioned wind year can create systematic biases across geographically correlated assets. An asset-level view may not capture this.
