El Niño 2026: what the headlines get right — and what they don’t
Written by Gerard Castro, Head of Technology at Nebbo.

There has been a wave of headlines recently about a potential “super El Niño” this year — record temperatures, widespread droughts, devastating floods, framed almost as certainties. I understand why: the models are showing a strong signal. But if you read the actual forecasting guidance, a more nuanced picture emerges. El Niño conditions are likely. How strong it will be is genuinely uncertain, and there are well-understood physical reasons for that.
I am drawing heavily on a recent science blog by Tim Stockdale at ECMWF [1], which I found to be one of the clearest assessments of the current situation.

Is a super El Niño going to occur?

El Niño is the warm phase of the El Niño–Southern Oscillation (ENSO) — ocean warming in the central and eastern tropical Pacific that drives global weather shifts. A “super” El Niño, loosely defined as sea surface temperature anomalies reaching 2°C or more, is historically rare — it has only happened a handful of times since 1950.
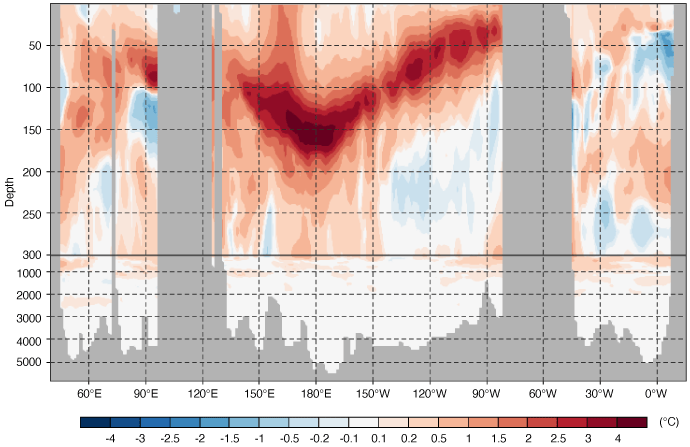
NOAA currently puts the probability of El Niño emerging this summer at 62% [2], and ECMWF’s SEAS5 and the C3S multi-model ensemble both show a clear warming trend. The sub-surface ocean signal is coherent and stronger than at the same point in 2017, and at least as strong as in 2023.
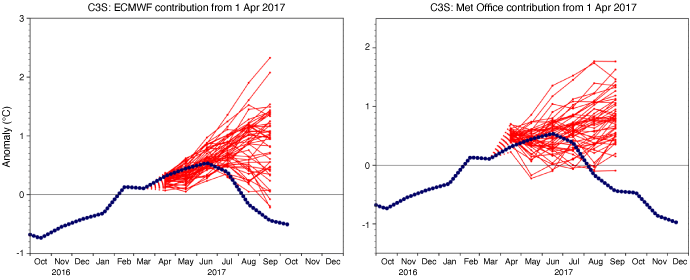
What the headlines skip: the model spread is enormous. Individual NINO3.4 forecasts for later this year range from 0.2°C to 3.3°C — the difference between near-neutral and the strongest El Niño on record. NOAA puts the “super” event probability at 1 in 4 (Figure 1). The 2017 analogue is instructive: models called for El Niño in spring, La Niña arrived by winter (Figure 2). That remains ECMWF’s worst March ENSO forecast on record. The current signal is a probability distribution, not a deterministic prediction.

Figure 1. In November 2026- January 2027, there are nearly equal chances (25%) of a very strong, strong, or moderate strength El Niño. Extracted from [2]

The spring predictability barrier
 

This uncertainty is not a model failure — it is the spring predictability barrier, a well-documented feature of the climate system. Between March and May, the ocean-atmosphere coupling in the tropical Pacific is at its weakest, making the system inherently harder to forecast. Individual models tend to be overconfident; the actual outcome can fall outside their predicted range. This is why C3S maintains a multi-system ensemble: eight different centers produce a wider, better-calibrated spread than any single model.
The picture will sharpen in late May and June, when coupling strengthens and the physical fingerprints of a developing El Niño — weakening trade winds, westerly wind bursts, surface warming — either appear or do not. Until then, we are still in the uncertain window.
Climate change adds one more wrinkle: rising background temperatures make NINO3.4 anomalies look larger against a fixed historical baseline. NOAA recently shifted to measuring relative SST anomalies to better isolate the ENSO signal; other tools have not, so some headline figures may be slightly inflated.

Figure 2. The spring predictability barrier affected April 2017 real-time forecasts of NINO3.4 SST. After some initial warming, SSTs cooled and La Niña conditions developed. Extracted from [1].

Why should this matter to stakeholders (asset managers, traders…)?

A strong El Niño ripples across every climate-sensitive sector. In particular, it weakens the trade winds that power some of the world’s most productive wind regions — from Northeast Brazil to the Caribbean — and can suppress wind regimes across the tropics for months, directly hitting capacity factors and production estimates across affected portfolios. Reduced rainfall cuts hydro-power output while heating and cooling demand shifts — relevant for anyone exposed to electricity or gas markets. Wildfire and flood loss profiles shift in ways that move insurance pricing; as well as droughts can hit crop yields moving commodity prices across Australia, southern Africa, and South Asia.
Outside the tropics the signal is less clean, mediated by the Arctic (AO) and North Atlantic Oscillations (NAO) — worth keeping in mind before placing strong regional bets on an El Niño narrative alone.
The right posture is to build contingency scenarios now — moderate El Niño, strong, none — and understand the exposure under each.
As Celeste Saulo, Secretary General of the World Meteorological Organization, put it in [3]:

“Seasonal forecasts for El Niño and La Niña help us avert millions of dollars in economic losses and are essential planning tools for climate-sensitive sectors like agriculture, health, energy and water management.”

At Nebbo, this is the kind of intelligence we provide — translating ENSO signals and seasonal outlooks into actionable insights for energy companies, traders, and asset managers. If you are thinking about how the evolving forecast picture might affect your operations or portfolio, we would be glad to talk.

References

[1] Tim Stockdale, ECMWF Science Blog, April 2026 — El Niño 2026
[2] NOAA Climate Prediction Center, ENSO Outlook, April 2026 — CPC ENSO Forecast
[3] The Guardian, April 2026 — Are we heading for ‘super El Niño’?