

Written by: Yazmina Zurita

Climatology of a site
Climatology represents the long-term average of meteorological variables, such as wind speed or temperature. It effectively summarizes a location’s historical weather conditions into a single, static metric. The information provided by this metric serves two primary applications:
1. Predictive utility
One might propose, for instance, that “the expected wind speed for next December will closely resemble the average of previous Decembers”. By this logic, we can easily estimate next year’s wind park productivity by examining climatological data. Furthermore, by identifying months with historically lower averages, we can optimize future maintenance schedules to minimize operational downtime losses.
While these forecasts can be reasonably accurate for systems with little temporal variability, the Earth’s climate system is inherently dynamic.
Analyzing a variable over time reveals four primary components in its time series: trend, cyclicity, seasonality, and irregularity. These elements signify variations across different temporal scales. Utilizing averages over an extensive period tends to obscure the rich insights offered by examining these individual components
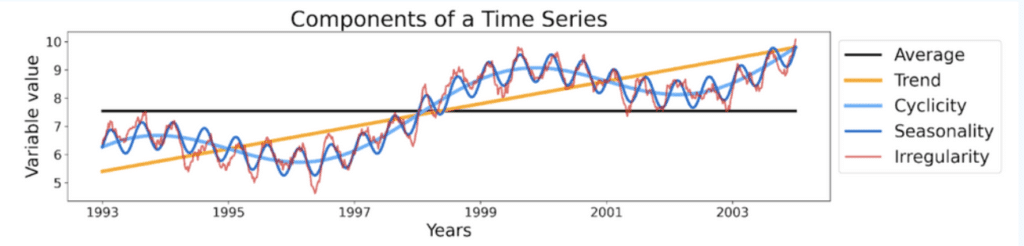
Figure 1. Decomposition of a time series into four components: trend, capturing long-term movement; cyclicity, indicating longer-term fluctuations; seasonality, representing regular periodic patterns; and irregularity, showing unsystematic variations.
While relying solely on climatology for future predictions is convenient, it providesonly a generalized view of past conditions, leading to imprecise forecasts.
2. Deriving anomaly values
Climatology also facilitates the calculation of anomaly values, indicating the degree to which a given observation deviates from the long-term average. This data representation is highly interpretable, clearly showing whether a value is above or below the norm. Additionally, knowing a meteorological variable’s anomaly enables easy conversion of this deviation into anomalies for related variables like production yield, sales, or crop harvest.
It is worth noting that altering the climatological period— the interval over which the average is computed— affects the resulting anomaly. This is particularly true when averaging over two distinct, brief periods that may not accurately represent broader trends.
In summary, deriving long-term averages of meteorological variables serves as a useful tool for forecasting and anomaly computation. However, relying solely on climatology for predictions imposes significant limitations, resulting in only approximate forecasts. In contrast, employing climatology to calculate anomaly values enhances the interpretability and transferability of data to related variables.
