


Written by Gerard Castro, CTO at Nebbo, and Yazmina Zurita, R&D Data Scientist at Nebbo.
With this entry, a series of blog posts is started in order to provide a basic outlook of the next months’ in India. In particular, the content will focus on the wind to be expected for these months prior to the Monsoon season and its transition and, specially, on 3 different regions.
Disclaimer: the rationale behind these outlooks is to present the capabilities and limitations of the most well-known seasonal models. These are obtained from C3S and bundled in a multi-model fashion, without any other complex postprocessing. In particular, a more indepth analysis would require features as those present in our site forecast product:
– Model downscaling to remove bias & variance issues, as well as reliability problems, by increasing the resolution.
If no finer observational reference is used (no downscaling), the models’ resolution is 1º, as made explicit in Fig. 1.
– Full probabilistic overview
– Re-forecast skill analysis & accounting for the forecast error
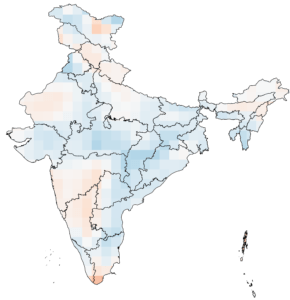
Fig. 1. Models’ original resolution is 1º.
That said, the India forecast initialized this March 2025 is presented below for the multi model and lead months 2 & 3, i.e. valid for April & May.
April 2025: lead month 2
The probabilistic predictions of the seasonal models, including our multi model, offer several attributes which must be assessed when outlooking next month’s state. In particular, a common way of synthesizing this ensemble of forecast members is through its “ensemble mean” (ensmean). By averaging the members, the expected value for next month’s wind speed can be assessed.
If we subtract this value with respect to the climatological mean, i.e. the average of model’s outputs along the baseline period (1993-2016 in our case), we obtain the ensmean anomaly. In Figure 2, the ensmean anomaly is shown for all of India and its territories as a relative difference in percentage:
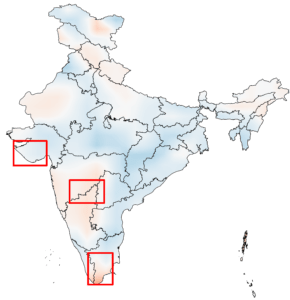

Fig 2. Multi model wind speed anomaly (ensmean) for India. In red, the regions to focus on. Baseline period: 1993-2016.
In red, the areas of interest are highlighted. Of course, this allows for a simple quantification of the “intensity” of next month’s anomalies. However, this outlook is incomplete without a proper quantification of its probability.
Then, for instance, if we were to find the probability of next month’s wind speed being lower than “normal” we could identify how many of the model’s ensemble members are below the climatological “lower tercile” (i.e. the 33rd percentile, or P33 value).
Analogously, the probability of next month’s wind speed being higher than “normal” can be found in terms of the members above the “upper tercile” (66th percentile, or P66); and the probability of next month’s being “normal” corresponds to the percentage of members between P33 & P66.
By carrying out this, we can characterize the model’s confidence of such events and, if we plot them, we obtain a representation as Figure 3.
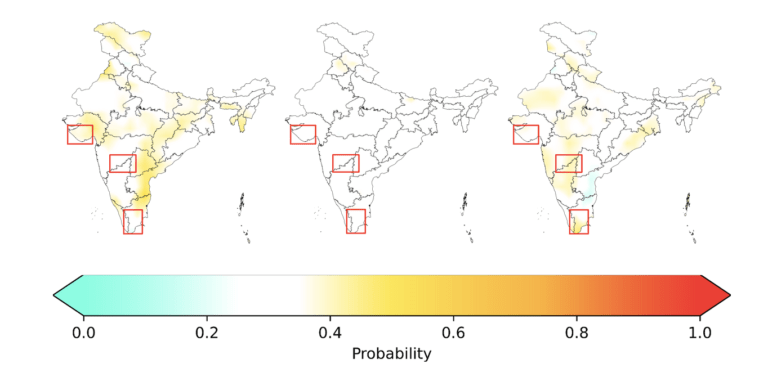
Fig 3. Multi model probability. From left to right: low, normal & high wind probabilities. Baseline period: 1993-2016.
Now, if we focus on the three regions, we can notice:
- Region 1 (composed by north of Karnataka, south east of Maharashtra & west Telangana)
- The members are quite evenly distributed across the terciles, even though there is a faint signal for being inclined to a windier month.
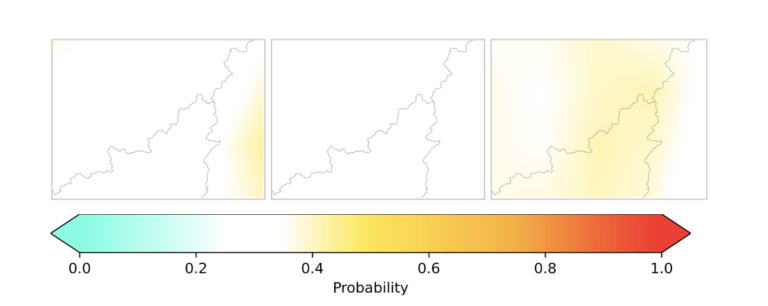
Fig 4. Multi model probabilities for region 1 (from left to right: probability of having less, average & more wind).
- Region 2 (composed by north of Gujarat)
- There is some possibility that the month is less windy than usual, especially in the most eastern part.
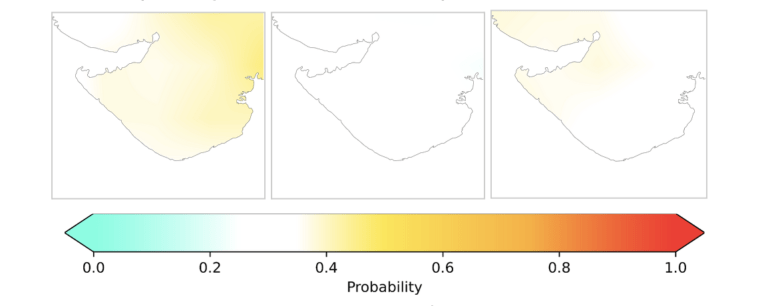
Fig 5. Multi model probabilities for region 2 (from left to right: probability of having less, average & more wind).
- Region 3 (composed by east of Kerala & west of Tamil Nadu)
- Whereas the northeast part of the region exhibits significant probability of having a slightly less windy month, there is a strong signal for the south of Tamil Nadu being windier than normal.
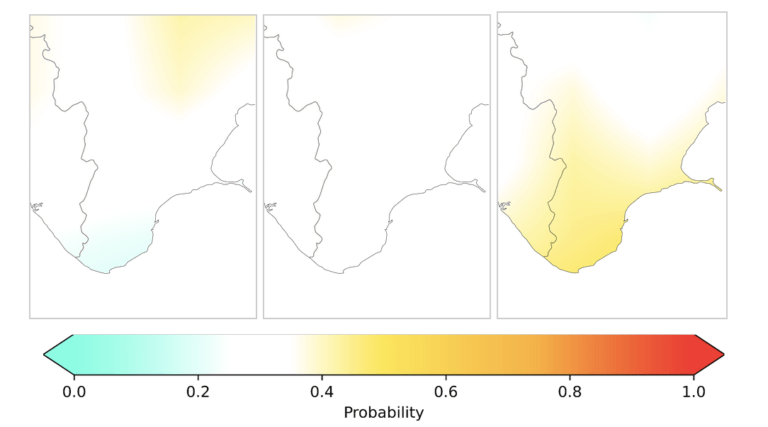
Fig 6. Multi model probabilities for region 3 (from left to right: probability of having less, average & more wind).
May 2025: lead month 3
Through an analogous process for May (lead month 3), we obtain the ensmean anomaly for India as depicted in Figure 7, as well as the probability maps in Figure 8.
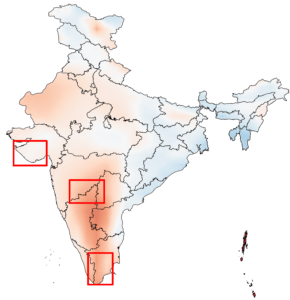
Fig 7. Multi model wind speed anomaly (ensmean) for India. Baseline period: 1993-2016.
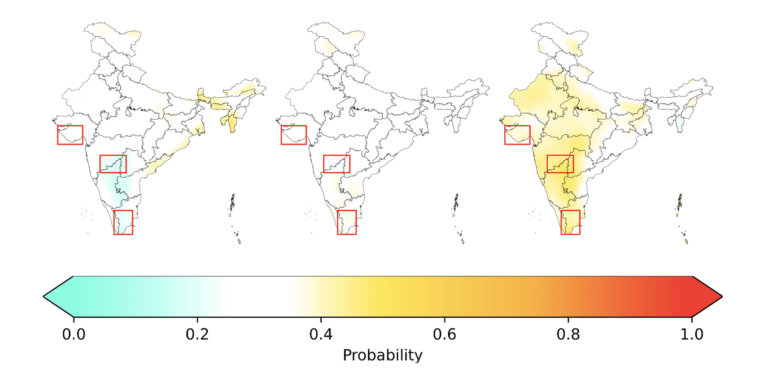
Fig 8. Multi model probability. From left to right: low, normal & high wind probabilities. Baseline period: 1993-2016.
All of the above bring us to the following conclusions:
- Region 1 (composed by north of Karnataka, south east of Maharashtra & west Telangana)
- There is a strong signal for a windier month in most of the region, with a particularly pronounced tendency in the southeastern quadrant, where conditions appear more favorable for stronger winds than normal (lower discarded).
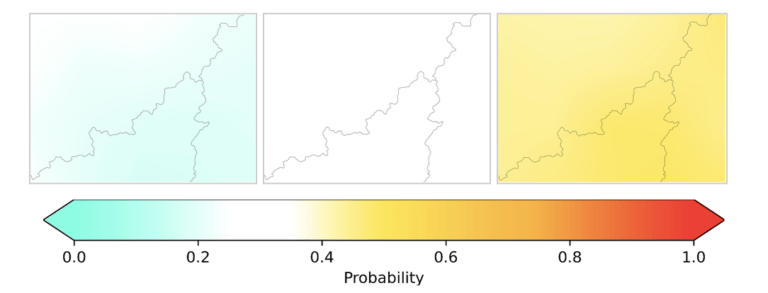
Fig 9. Multi model probabilities for region 1 (from left to right: probability of having less, average & more wind).
- Region 2 (composed by north of Gujarat)
- There is a moderate probability for windier conditions across the entire region. The rest of ensemble members are distributed equally on lower than normal and normal wind conditions.
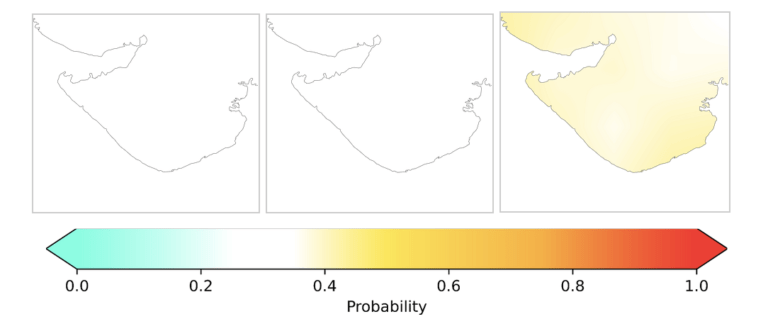
Fig 10. Multi model probabilities for region 2 (from left to right: probability of having less, average & more wind).
- Region 3 (composed by east of Kerala & west of Tamil Nadu)
- Most of the region is likely to experience stronger winds, with the signal being especially pronounced in the southern areas, where a windier month seems more probable than normal wind (lower winds discarded).
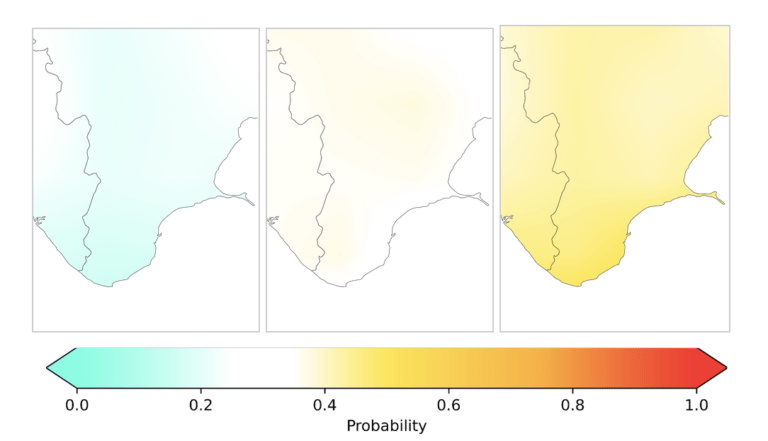
Fig 11. Multi model probabilities for region 3 (from left to right: probability of having less, average & more wind).
Summary
In this analysis, we have explored the upcoming wind conditions in India leading up to the Monsoon season. The data suggests a transition from less windy conditions in April to potentially stronger winds in May. We have used anomaly maps to illustrate deviations from typical wind patterns and probability maps to assess the likelihood of various wind scenarios. Understanding these shifts is crucial for preparing for the changing wind dynamics as the Monsoon approaches.
